
Deep dive | October 28, 2026 | Commercial aircraft leasing, with engine, cargo and business-aviation context
Aircraft leasing can deliver excellent reported profits after conditions for the next investment have become less attractive. That distinction is central to understanding the industry in late 2026. Scarce aircraft still support owners, but weaker traffic, uneven rental trends and the price of acquiring replacement assets complicate the outlook for new capital.
Our assessment: leasing is in a mature phase supported by scarce equipment, with early normalization in parts of the rental market and growing sensitivity to airline credit. The evidence does not establish a single global peak date. It does show a widening difference between earning returns on aircraft already owned and buying aircraft at today’s prices. Investors should read record earnings alongside the economics of the next lease, purchase and refinancing.
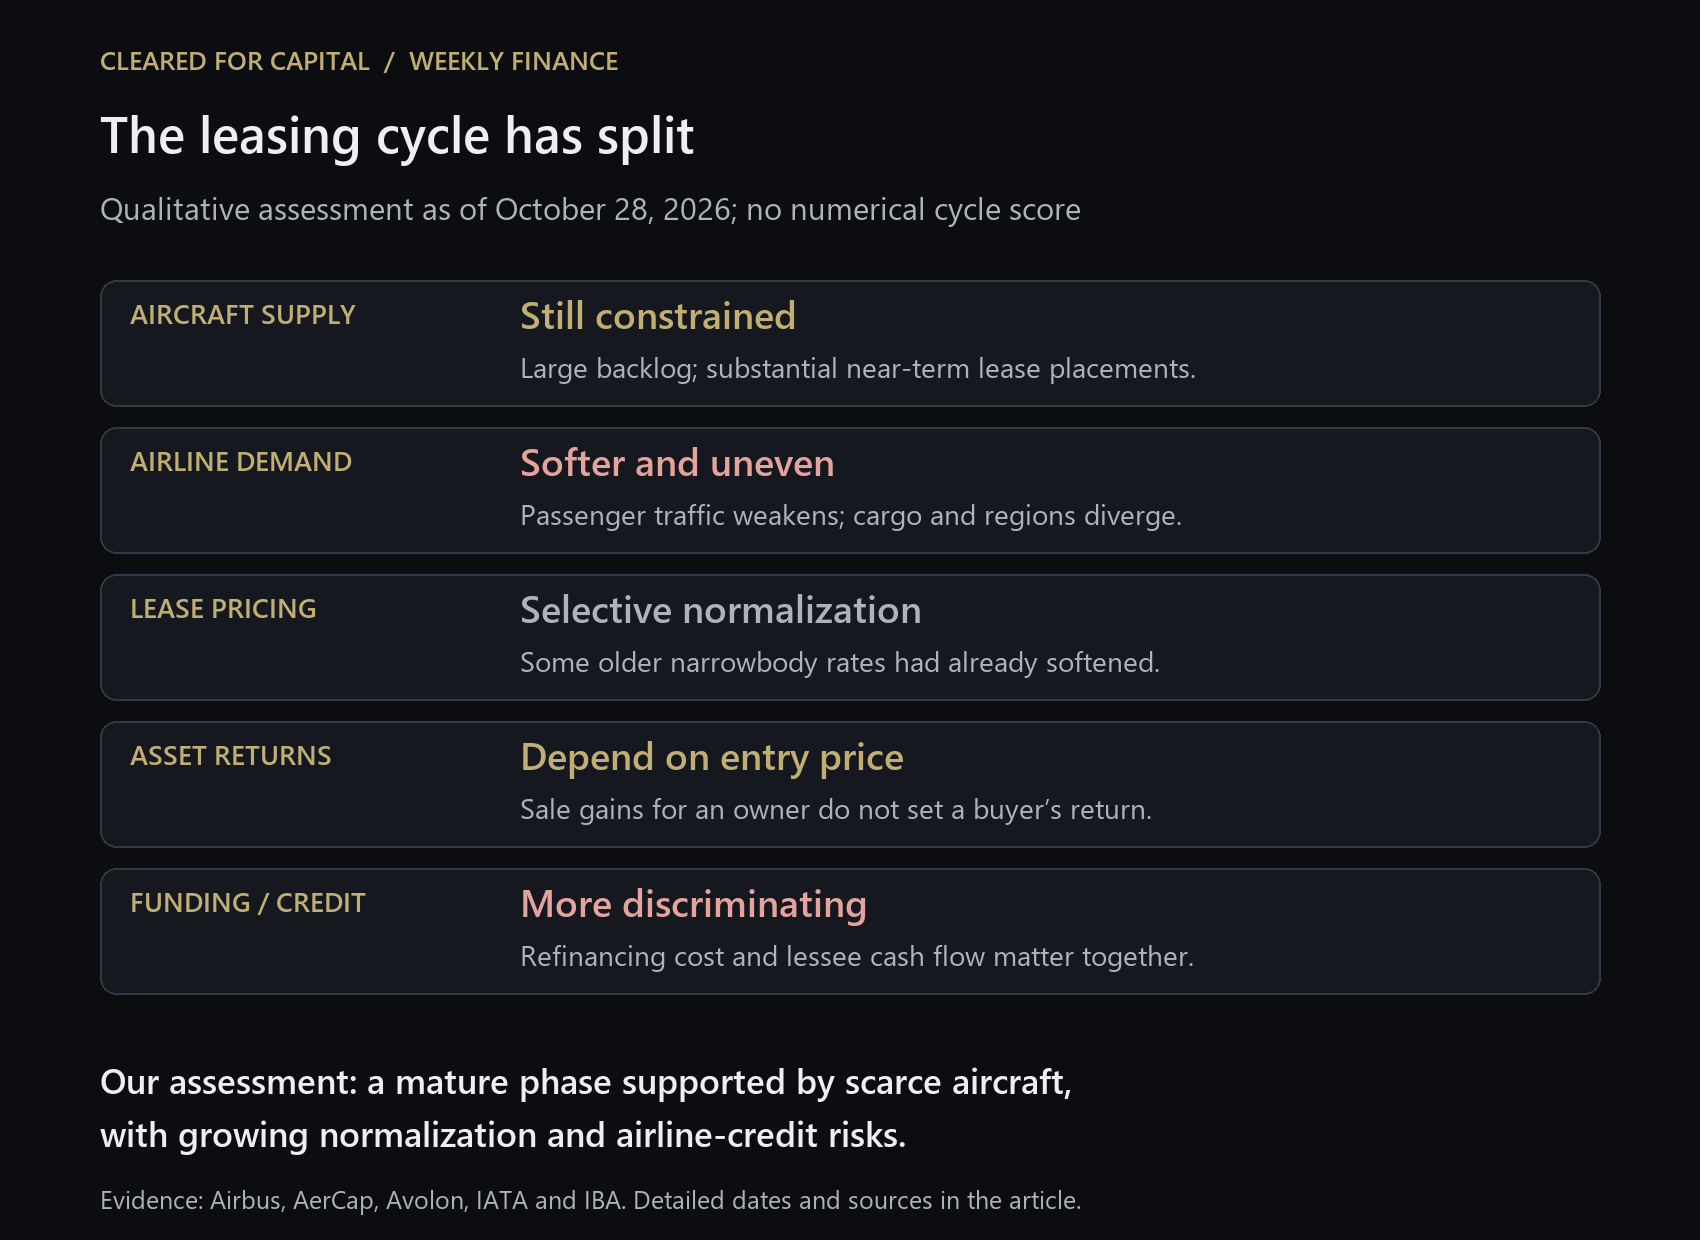
Why the leasing cycle has several moving parts
Four developments determine the cycle: airlines’ demand for capacity, the availability of usable aircraft, the price paid for those assets, and the cost and availability of financing. They do not turn together. Aircraft orders can take years to deliver; leases delay the repricing of an existing portfolio; maintenance can keep apparently available aircraft out of service; and debt can refinance before rental income resets.
A typical recovery absorbs parked aircraft and restores collections. A tighter market then improves placement terms and supports asset sales. As production catches up, rents and values can stabilize even while lessors report strong earnings from earlier investments. A downturn becomes more damaging when weaker airline cash flow, aircraft returns and tighter financing reinforce each other. This is a framework for interpreting evidence, rather than a timetable every aircraft type follows.
The business model matters too. This article focuses on operating lessors that retain aircraft and residual-value exposure. An aircraft loan, finance lease, engine lease and ACMI contract—aircraft, crew, maintenance and insurance—have different risks. Short-term operational leasing can respond rapidly to airline capacity changes while a long-term dry lease continues to generate contracted rent.
The evidence: scarce aircraft, softer passenger growth and strong lessor earnings
Airbus’s nine-month results, released October 28, report 547 commercial deliveries against 1,105 net orders, with a backlog of 9,310 aircraft at September 30. That supports the case for continued equipment scarcity. It does not establish the delivery date, financing availability or rental rate for an individual aircraft; order books contain delivery schedules, contractual conditions and cancellation risks.
Avolon’s October 9 business update reported that 89% of its committed fleet for the following 24 months was placed at quarter-end. That is meaningful evidence of forward demand for its delivery stream. It is a company-specific placement measure, rather than the percentage of the entire world fleet leased or a measure of airline credit quality.
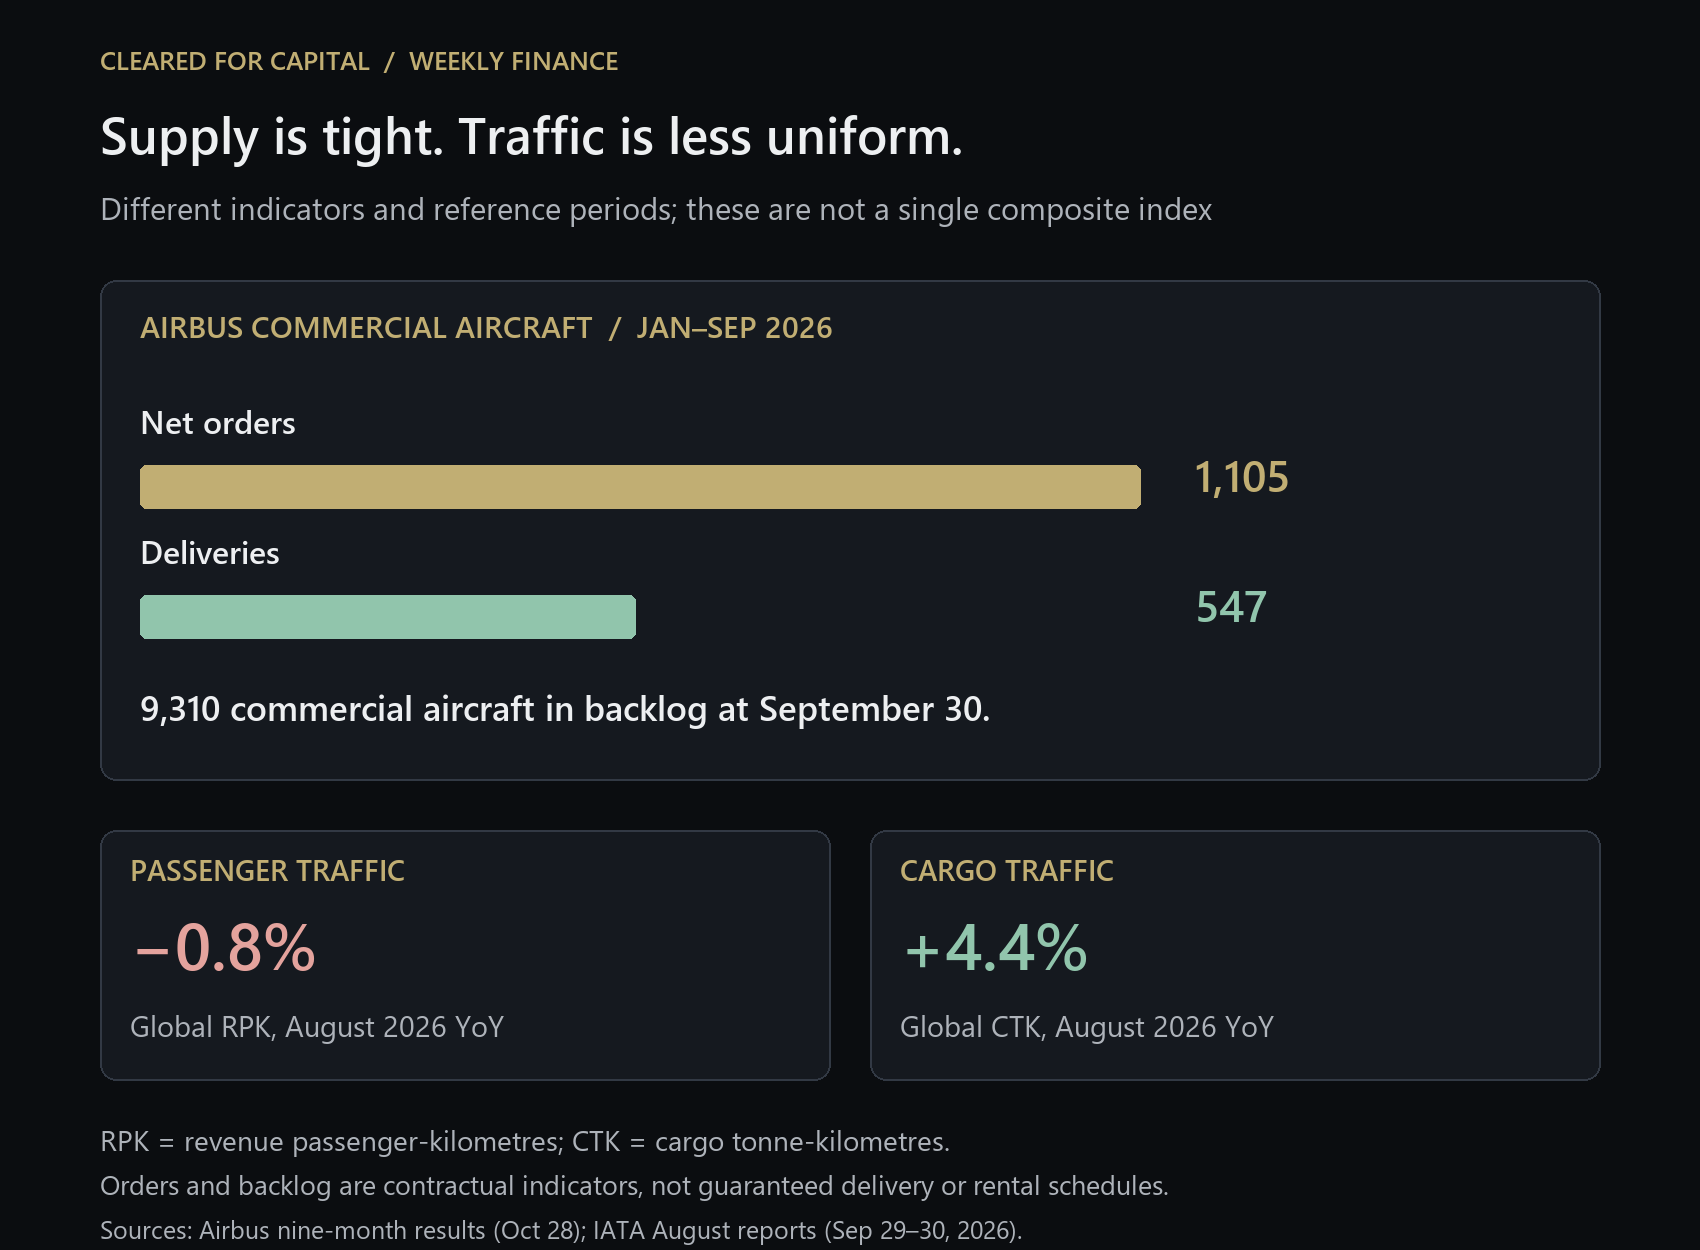
Demand sends a less comfortable signal. IATA reported August passenger traffic down 0.8% year-on-year, capacity up 0.3% and an 85.1% passenger load factor. Excluding Middle Eastern carriers, traffic rose 0.6%. The weakness is therefore uneven, with a substantial regional disruption component, rather than evidence that every airline market is contracting. Nevertheless, slower traffic growth reduces the cushion available to absorb expensive fuel, aircraft and financing.
At the same time, AerCap’s October 28 results show $1.009 billion of adjusted third-quarter net income and $353 million of asset-sale gains. Basic lease rents were $1.698 billion versus $1.690 billion a year earlier; maintenance rents and other receipts increased 31%. Adjusted earnings include asset-sale gains. These figures show strong monetization of an existing portfolio, while reminding readers that recurring basic rent, maintenance-related income and gains on disposals are different earnings streams.
That combination is consistent with a mature phase: owners continue to realize value from earlier purchases while the growth and pricing signals become less uniform. Neither one lessor’s profit nor one month’s traffic determines the cycle. Together with placements and rental evidence, they help identify where the pressure is moving.
Lease rates can normalize before aircraft values fall
In a June 2026 chapter using first-quarter valuation evidence, IBA’s Jon Whaley described a second consecutive softening in previous-generation narrowbody lease-rate opinions, alongside slower increases for newer narrowbodies. These are dated appraisal opinions, not October transaction quotes. They are enough to challenge a blanket claim that rental rates are still accelerating for every aircraft type.
A lease rate is the price of using an aircraft over a period. Its asset value also reflects the remaining aircraft life, engine condition, maintenance status and alternative uses. Those components can move differently. A serviceable engine or valuable parts can support an aircraft’s sale price while the rent an airline will pay for the complete aircraft weakens. High maintenance costs can increase the value of usable equipment and simultaneously make an aircraft approaching overhaul less attractive.
For an older narrowbody, an extension can preserve income and avoid transition costs. But the extension’s economics depend on negotiated rent, reserves, maintenance obligations and the next exit opportunity. Counting extensions without reading their terms can hide a softer market. An appraisal also should not be substituted for an executable bid after maintenance, transfer and remarketing costs.
The critical distinction: owning an aircraft versus buying one now
A lessor that acquired an aircraft at a favourable price can earn attractive rent and later sell above depreciated book value. The buyer paying that sale price starts with a different cost basis. A large gain for the seller is not evidence that the buyer will reproduce the seller’s investment return. This is particularly important when scarce assets attract capital that competes more aggressively on purchase price than on lease terms.
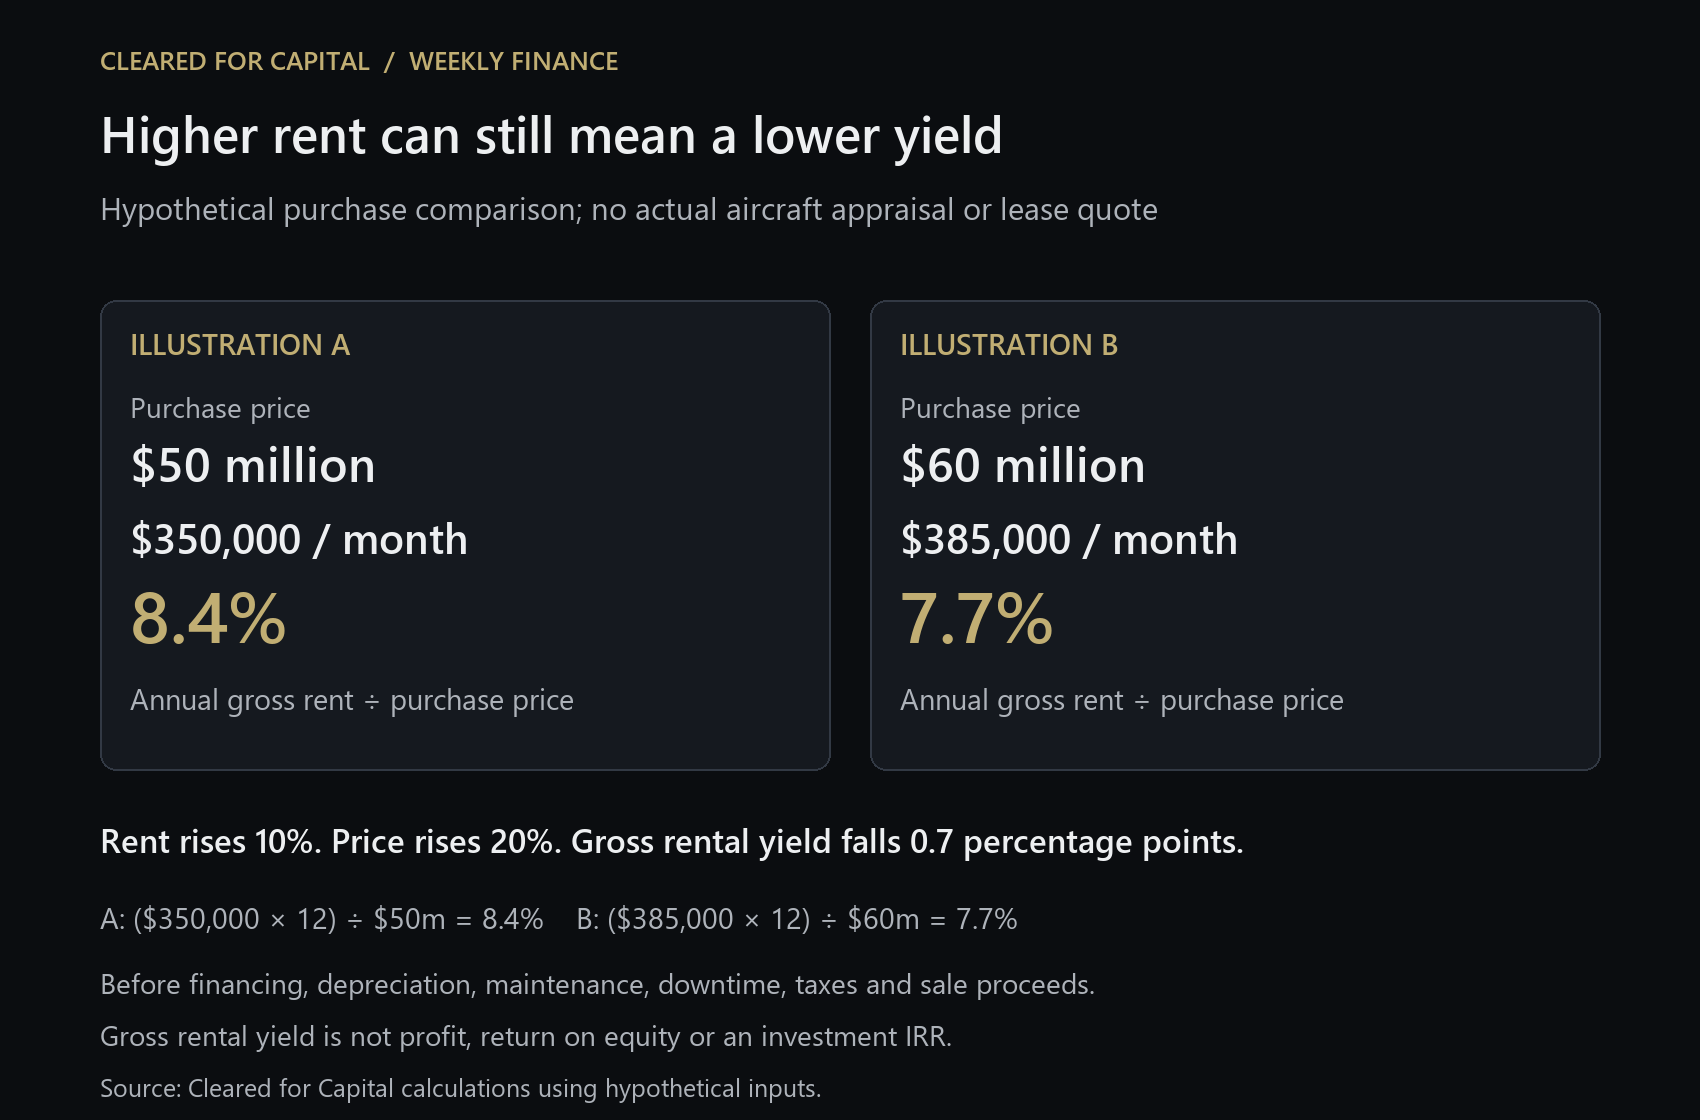
In the hypothetical comparison above, monthly rent rises from $350,000 to $385,000, but purchase price rises from $50 million to $60 million. Annual gross rental yield falls from 8.4% to 7.7%. The calculation is annual rent divided by purchase price; it excludes financing, depreciation, maintenance, downtime, taxes and residual proceeds. It is neither an investment IRR nor an expected market return.
The cycle risk lies in underwriting a high entry price, optimistic renewal rent and a generous exit value together. If those assumptions depend on the same persistent shortage, diversification across many aircraft may provide less protection than expected. A portfolio can contain many assets while remaining exposed to one common supply-and-demand assumption.
Acquisition vintage therefore matters alongside aircraft age. A young aircraft purchased expensively can have less room for error than an older aircraft bought at a low price with its maintenance properly funded. The relevant question is the cash return on the capital committed now, including downside exit assumptions, rather than whether the aircraft belongs to a popular category.
Financing can tighten while existing leases keep looking healthy
AerCap reported an average third-quarter cost of debt of 4.2%, up from 4.0% a year earlier, on its stated measure excluding issuance costs, upfront fees and other impacts. Its average remaining passenger-aircraft lease term was 7.4 years. Those company-specific measures illustrate why funding costs and the repricing of rental income can move on different schedules.
For a lessor with fixed rentals and refinancing ahead, higher debt costs can compress cash margins before the aircraft’s lease expires. For another with matched funding, contracted escalators or effective hedges, the same market change can be more manageable. A headline policy rate does not describe either company’s complete economics. Funding tenor, amortization, currency, hedge collateral and the availability of committed liquidity all matter.
There is also a timing counterweight to an immediate crisis narrative: IATA’s October 16 economics briefing placed most airline refinancing needs beyond the next two years. That aggregate observation does not protect every airline or describe lessors’ own maturity schedules. It does mean the credit analysis should distinguish a borrower with a near-term cash problem from a well-funded operator facing higher costs later.
Leverage magnifies the asset-price cycle. In a separate hypothetical example, a $100 million asset financed with $65 million of debt has a $35 million equity cushion. A 20% asset-value fall leaves $15 million if debt is unchanged: a roughly 57% reduction in that simplified cushion, before costs. This is not a forecast, an issuer’s leverage ratio or a statement about daily accounting marks; it shows how residual risk can reach equity disproportionately.
Airline credit is the link between scarcity and collections
A scarce aircraft is useful protection only if its current lessee pays or another operator can take it on workable terms. Weak traffic, fuel exposure or a currency mismatch can impair collections before an asset’s appraised value declines. Repossessing and moving an aircraft can involve downtime, restoration expense, records work and jurisdictional constraints. Portfolio occupancy alone does not capture those costs.
The pressure can also increase demand for leasing: an airline conserving cash may prefer a lease to a direct purchase. Air Lease’s June-quarter SEC filing describes airline financing needs and tight capital availability as potential supports for leasing, while identifying customer insolvency and higher operating costs as risks. More airline demand for finance does not automatically mean a safer customer or a better risk-adjusted lease.
The earlier warning signs are cash collection, rent deferrals, security top-ups, maintenance shortfalls and weaker terms on replacement leases. Reported earnings can respond later because a long contractual lease and an aircraft appraisal smooth some signals. Our AASET/WAVE deep dive discusses how collections, reserves and aircraft recovery affect the bonds backed by those cash flows.
Engines, widebodies, cargo and business jets occupy different positions
Engine availability and maintenance economics can keep certain assets valuable even when airframe rental growth slows. The analytical distinction is between airworthy capacity that can earn revenue now and a nominal fleet count that includes aircraft awaiting engines, parts or restoration. For a lessor, a higher engine value is helpful only after allowing for technical condition and the cost of realizing that value.
Widebodies also require route, cabin and customer-specific analysis: a shortage on one long-haul network does not make every widebody easy to place elsewhere. In cargo, IATA’s August figures show demand up 4.4% year-on-year while capacity declined 0.1%. That supports a more resilient demand reading than the passenger aggregate, but freight demand is not a guarantee of profitable conversion economics. Feedstock cost, conversion expense, delivery timing and the eventual lessee still determine the return.
Business aviation provides another differentiated picture. Global Jet Capital’s second-quarter 2026 market brief reports 6.6% of the business-jet fleet available for sale, versus a roughly 10% historical average. Availability was 3.7% within the cohort aged 12 years or less, compared with 8.2% for aircraft aged 13 years or more. Its like-aged bluebook basket increased 2.9% year-on-year but only 0.3% quarter-on-quarter. These are inventory and valuation indicators, not closed-sale prices or operating-lease yields.
For business-jet leasing, model liquidity, cabin specification, maintenance-program coverage, borrower strength and the eventual return condition can matter more than an airline-style traffic indicator. Younger aircraft scarcity can coexist with greater choice in older jets. The market evidence supports segmentation and selective normalization, rather than transferring a commercial-airliner cycle label wholesale to every private aircraft.
What would change the cycle assessment?
Our central case is a prolonged mature phase with selective normalization. A severe downturn would require more evidence of weaker collections, harder remarketing and capital withdrawal; a renewed broad upswing would require stronger demand and improving new-investment economics. The following are conditional paths, without assigned probabilities or forecasts of a particular aircraft’s value.
- Scarcity persists: delivery and maintenance bottlenecks remain significant, airline liquidity holds up and forward placements stay strong. Incumbent owners retain negotiating power, although high entry prices can still constrain buyers’ returns.
- Orderly normalization: usable aircraft supply grows faster than incremental demand. Renewal rents and trading gains moderate, with the outcome varying by model, vintage and maintenance condition. A lessor can remain profitable during this transition.
- Credit-led downturn: weaker airline cash flow produces deferrals and returns while debt and transition costs remain high. More available aircraft then weaken remarketing terms, turning a lessee problem into a residual-value problem.
Six indicators worth following through the next reporting cycle
- New placements and renewals: compare rents for equivalent aircraft, credits and maintenance conditions, including concessions.
- Cash collections: track arrears, deferrals and security usage alongside contracted revenue.
- Usable availability: separate airworthy aircraft from parked or maintenance-constrained supply.
- Net sale economics: compare actual bids after transition costs with appraisals and book gains.
- Funding and maturities: examine each lessor’s refinancing schedule and hedged all-in cost against rental resets.
- Capital discipline: test whether new purchases still earn an adequate return under lower renewal rents and more conservative residual assumptions.
The strongest operators can navigate this phase through acquisition discipline, technical capability, diversified customers and reliable funding. A rising sector average cannot substitute for those advantages. In late 2026, the business of aircraft leasing still benefits from scarcity, while the investment decision increasingly depends on the price paid and the ability to withstand a less forgiving next lease.
Sources and method: primary company disclosures from AerCap, Airbus, Avolon and Air Lease; IATA traffic and economics publications; IBA’s authored valuation chapter; and Global Jet Capital’s market brief. Information reviewed October 28, 2026, New York. Reference periods are stated because the releases are not synchronous. Company figures are examples, not a weighted industry census. The cycle assessment and scenarios are Cleared for Capital analysis; hypothetical illustrations are clearly separated from reported data.